In a previous blog post we showed how to use a single Flock Networks Router to monitor your entire network, using the OSPF Link State Database. In this blog post we demonstrate a technique to monitor your network, using the client, application and language of your choice.
Users of the Flock Networks Routing Suite have been telling us that they like the network status information being presented in a JSON format. However it is frustrating not being able to easily get that information off the router. Ethan Banks was kind enough to live stream his first use of the Flock Networks Routing Suite. Ethan talks about wanting a remote monitoring API here. We have listened to this feedback, and Flock Networks Routing Suite version 20.0.4 now implements a REST API.
The REST API returns a JSON payload inside HTTP. Combining these two widely used standards allows the API to talk to a huge variety of clients. The REST API is by design Read-Only, you can view the network state but cannot change it. In HTTP terms this means the only HTTP method that is supported is GET.
Monitor using a Router

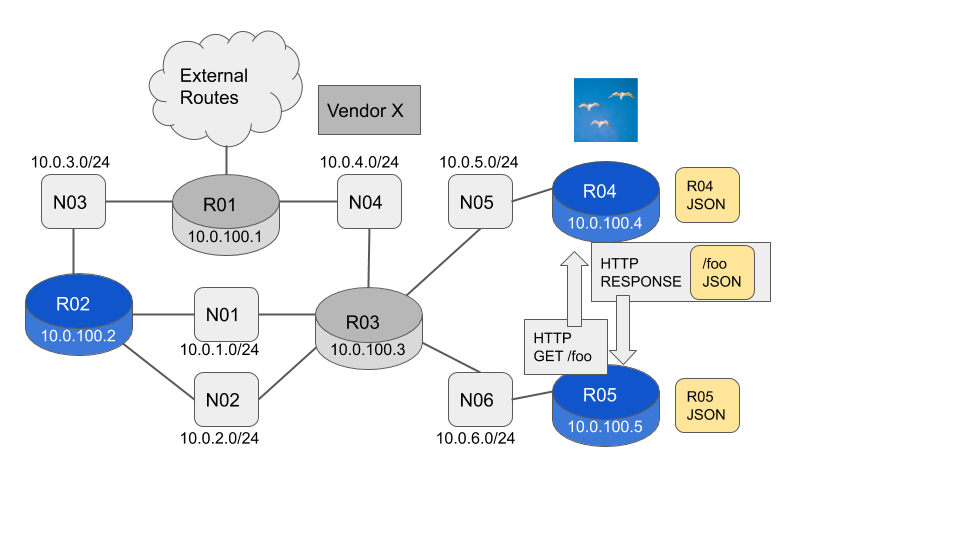
To see the local state we use the existing client connection. This is a local Unix Domain Socket delivering a JSON payload.
flock@R05:~$ flockrsc ribv4 --prefix
{"ip_net":"0.0.0.0/0","origin":"Ospfv2","next_hops":[{"intf_id":2,"ip_addr":"10.0.6.189"}]}
{"ip_net":"10.0.1.0/24","origin":"Ospfv2","next_hops":[{"intf_id":2,"ip_addr":"10.0.6.189"}]}
{"ip_net":"10.0.2.0/24","origin":"Ospfv2","next_hops":[{"intf_id":2,"ip_addr":"10.0.6.189"}]}
    ...
To see the remote state we just add a --host <host-name / host-ip> option to the command. This is a remote connection using HTTP delivering a JSON payload. The JSON payload has an identical format to the payload returned by the local command.
flock@R05:~$ flockrsc ribv4 --prefix --host R04
{"ip_net":"0.0.0.0/0","origin":"Ospfv2","next_hops":[{"intf_id":2,"ip_addr":"10.0.5.225"}]}
{"ip_net":"10.0.1.0/24","origin":"Ospfv2","next_hops":[{"intf_id":2,"ip_addr":"10.0.5.225"}]}
{"ip_net":"10.0.2.0/24","origin":"Ospfv2","next_hops":[{"intf_id":2,"ip_addr":"10.0.5.225"}]}
There is no summarization in this network, so we expect all routers to have the same routes in the RIB. We can check this using the same technique we used in the previous blog post. We store the information we expect to be identical into a text file, then compare the text files for each router.
flock@R05:~$ flockrsc ribv4 --prefix --json-pretty | grep ip_net > R05-rib.txt
flock@R05:~$ flockrsc ribv4 --prefix --json-pretty --host R04 | grep ip_net > R04-rib.txt
flock@R05:~$ diff R04-rib.txt R05-rib.txt
flock@R05:~$
Monitor using a Host

The Flock Networks Routing Suite client is now available on its own. We can convert R05 into a host by removing the Routing Suite Daemon and installing the Client package.
flock@R05:~$ sudo systemctl stop flockrsd
flock@R05:~$ sudo dpkg --purge flockrsd
(Reading database ... 27722 files and directories currently installed.)
Removing flockrsd (20.0.4) ...
Purging configuration files for flockrsd (20.0.4) ...
flock@R05:~$ sudo dpkg -i flockrsc_20.0.4_amd64.deb
Selecting previously unselected package flockrsc.
(Reading database ... 27717 files and directories currently installed.)
Preparing to unpack flockrsc_20.0.4_amd64.deb ...
Unpacking flockrsc (20.0.4) ...
Setting up flockrsc (20.0.4) ...
flock@R05:~$
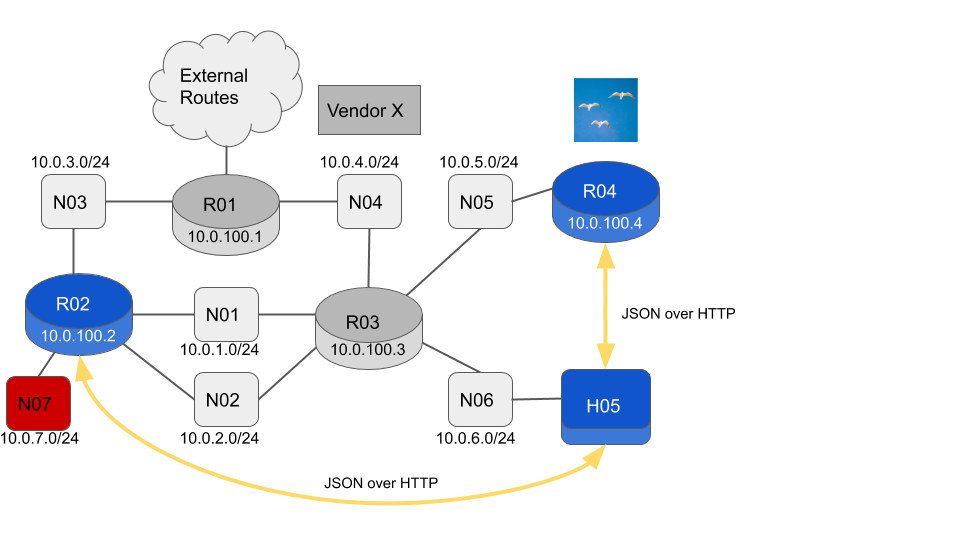
H05 is no longer running any routing code, but can still monitor the network using the REST API. Since we are now a host rather than a router, we need to add a default route via R03.
flock@H05:~$ sudo ip route add 0.0.0.0/0 via 10.0.6.189 dev enp1s0Let’s check that the RIB’s in R02 and R04 are consistent.
flock@H05:~$ flockrsc ribv4 --prefix --json-pretty --host R02 | grep ip_net > R02-rib.txt
flock@H05:~$ flockrsc ribv4 --prefix --json-pretty --host R04 | grep ip_net > R04-rib.txt
flock@H05:~$ diff R02-rib.txt R04-rib.txt
8d7
<     "ip_net": "10.0.7.0/24",
flock@H05:~$
So R02 has the N07 subnet but R04 does not. It looks like the new network N07 might not be being advertised in OSPF. Let’s check which interfaces on R02 are enabled for OSPFv2.
flock@H05:~$ flockrsc ospfv2 --area 0 --intf --host R02
{"ospf_area_id":"0.0.0.0"}
{"name":"enp1s0","id":2,"ip":"10.0.1.249/24","state":"Dr","dr_id":"10.0.100.2","dr_ip":"10.0.1.249","bdr_id":"10.0.100.3","bdr_ip":"10.0.1.246"}
{"name":"enp7s0","id":3,"ip":"10.0.2.167/24","state":"Dr","dr_id":"10.0.100.2","dr_ip":"10.0.2.167","bdr_id":"10.0.100.3","bdr_ip":"10.0.2.213"}
{"name":"enp8s0","id":4,"ip":"10.0.3.157/24","state":"Dr","dr_id":"10.0.100.2","dr_ip":"10.0.3.157","bdr_id":"10.0.100.1","bdr_ip":"10.0.3.176"}
flock@H05:~$
The interface connecting to N07 10.0.7.0/24 is not listed. Let’s check the newly live interface is in a good state (it probably is as we have already seen a RIB entry for it).
flock@H05:~$ flockrsc system --intf --host R02 | grep 10.0.7
{"name":"enp9s0","id":5,"ip_prefixes":["10.0.7.153/24"],"state":"Up"}
flock@H05:~$
Yes it is there, it’s name is “enp9s0” and it is Up. Let’s use ssh to look at the OSPFv2 config on R02.
    flock@H05:~$ ssh flock@R02 'cat /etc/flockrsd/ospfv2.toml'
    [ospf_v2]
    router_id = "10.0.100.2"
    [[ospf_v2.area]]
    area_id = "0.0.0.0"
    [[ospf_v2.area.intf]]
    name = "enp1s0"
    [[ospf_v2.area.intf]]
    name = "enp7s0"
    [[ospf_v2.area.intf]]
    name = "enp8s0"
And yes, we are missing the entry for “enp9s0”. Let’s ssh over to R02 and correct the OSPFv2 configuration. After that we can run our original RIB consistency test again, and we should get no diffs.
flock@H05:~$ flockrsc ribv4 --prefix --json-pretty --host R02 | grep ip_net > R02-rib.txt
flock@H05:~$ flockrsc ribv4 --prefix --json-pretty --host R04 | grep ip_net > R04-rib.txt
flock@H05:~$ diff R02-rib.txt R04-rib.txt
flock@H05:~$
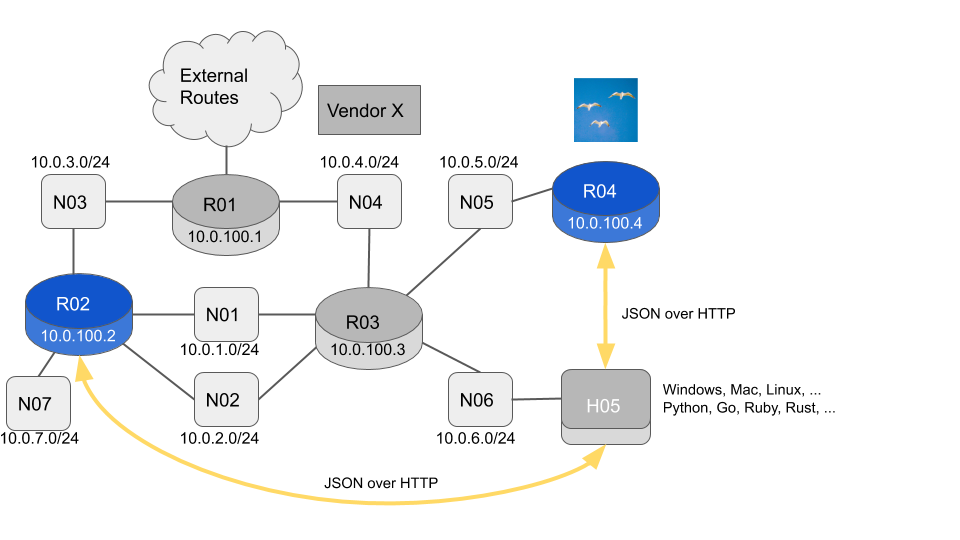
Monitor using whatever you like

The Operating System on H05 can be pretty much anything you like. You can choose which application to use to connect to the REST API. You can choose which language you want to use to process the network information.
Let’s choose curl as our application to connect to the REST API. It runs on pretty much every Operating System out there. Say we want to get the OSPFv2 Area 0 Link State Database from R04 and use it as input for a Python program. The command to get this information from the Flock Client would be:
flock@H05:~$ flockrsc ospfv2 --area 0 --lsdb --host R04 --jsonNote that we have added a --json option. The output is going to be fed into Python, so we want vanilla JSON, not the Flock Client default which is JSONL (JSON with extra newlines to help human readability).
If we add the --show-url option to any Flock Client command, it will display the REST URL that it would connect to, and then exit without attempting to actually connect.
flock@H05:~$ flockrsc ospfv2 --area 0 --lsdb --host R04 --json --show-url
REST API URL would be 'http://R04:8000/ospfv2/area?area_id=0.0.0.0/lsdb/json'
flock@H05:~$
We can then tell curl to HTTP GET from this URL and pipe the output into Python.
you@your-host:~$ curl -s -X GET "http://R04:8000/ospfv2/area?area_id=0.0.0.0/lsdb/json" | python -m json.tool
[
    {
        "lsa_age": 1742,
        "lsa_checksum": "0x8906",
        "lsa_id": "10.0.100.1",
        "lsa_len": 72,
        "lsa_opts": {
            "bits": 2
        },
        "lsa_router_id": "10.0.100.1",
        "lsa_seq": "0x80000009",
        "lsa_type": "Router"
    },
...
And that’s it. You now have complete visibility into your network. You have the network information in a structured format. You can use any tooling you like to operate on that information. Put on your Dev Ops hat and go forth and create !
More information on the REST API can be found here. The Flock Routing Suite can be downloaded for free from here.
If you have any feature requests, feedback etc, please email ‘support@flocknetworks.com’.
In the meantime “Happy Coding”
Nick

